
Hi Guys, in this post I would share how to show values on top of bars in Chart.js. My project used library Chart.JS to display a Chart from data sets.
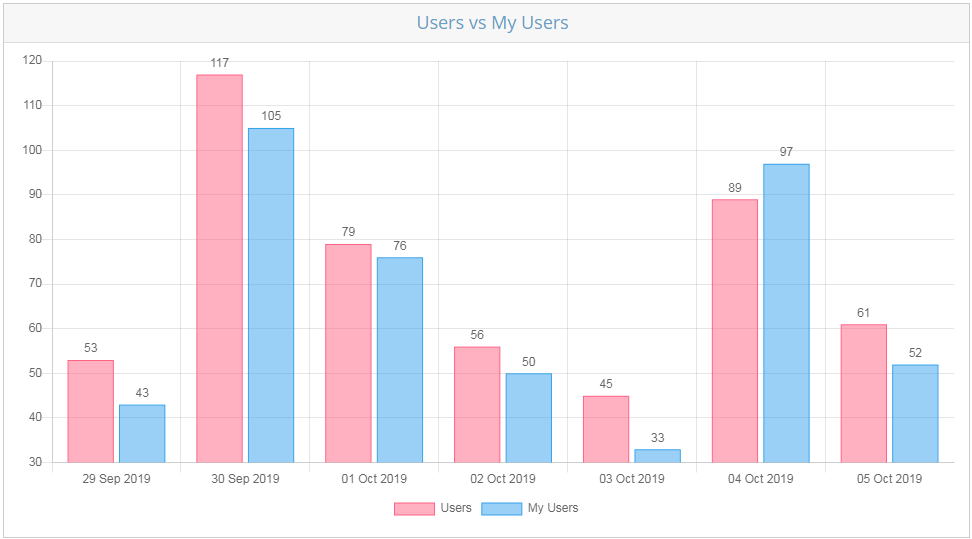
Previously, I have made a Chart in the form of a bar like a picture below. But on that Chart, I don’t know the exact value of each bar. To find out, I have to mouse over the Chart. Of course, this is not effective, if we want to present the Chart to the Client.

I’m trying to find a reference on how to display the values in each of the bars above. But I did not find the documentation on the official website. Until finally I found the solution through Stack Overflow, on a similar discussion topic. Then I tried to implement it in my project. And in the end, I can see the value of each bar right above it. By the way, thank you so much for Stack Overflow!

Regarding this project, I use Chart.JS version 2.8.0 with Utils. And for those of you who want to see the code snippet, can be seen below.
$(function() {
	var color = Chart.helpers.color;
	var UserVsMyAppsData = {
		labels: ['29 Sep 2019','30 Sep 2019','01 Oct 2019','02 Oct 2019','03 Oct 2019','04 Oct 2019','05 Oct 2019'],
		datasets: [{
			label: 'Users',
			backgroundColor: color(window.chartColors.red).alpha(0.5).rgbString(),
			borderColor: window.chartColors.red,
			borderWidth: 1,
			data: [53,117,79,56,45,89,61]
		}, {
			label: 'My Users',
			backgroundColor: color(window.chartColors.blue).alpha(0.5).rgbString(),
			borderColor: window.chartColors.blue,
			borderWidth: 1,
			data: [43,105,76,50,33,97,52]
		}]

	};

	var UserVsMyAppsCtx = document.getElementById('UsersVsMyUsers').getContext('2d');
	var UserVsMyApps = new Chart(UserVsMyAppsCtx, {
		type: 'bar',
		data: UserVsMyAppsData,
		options: {
			responsive: true,
			legend: {
				position: 'bottom',
				display: true,

			},
			"hover": {
		      "animationDuration": 0
		    },
			 "animation": {
			 	"duration": 1,
		      "onComplete": function() {
		        var chartInstance = this.chart,
		          ctx = chartInstance.ctx;

		        ctx.font = Chart.helpers.fontString(Chart.defaults.global.defaultFontSize, Chart.defaults.global.defaultFontStyle, Chart.defaults.global.defaultFontFamily);
		        ctx.textAlign = 'center';
		        ctx.textBaseline = 'bottom';

		        this.data.datasets.forEach(function(dataset, i) {
		          var meta = chartInstance.controller.getDatasetMeta(i);
		          meta.data.forEach(function(bar, index) {
		            var data = dataset.data[index];
		            ctx.fillText(data, bar._model.x, bar._model.y - 5);
		          });
		        });
		      }
		    },
			title: {
				display: false,
				text: ''
			},
		}
	});
});
Thank you for reading my post! Happy Coding!

This worked perfectly for me. I only needed the “animation” block. The only thing I had to change was to remove the quotations from the tags, otherwise it didn’t work.
There is little thing…I find a litte bit annoying that the values disappear and then reappear when positioning the cursor over the bars. Is there any way to stop this behaviour?
Thanks in advance.
LikeLike
Hi Rober,
The behavior was indeed a little annoying, I experienced it. Unfortunately, I haven’t found a solution to date.
Thanks,
Bramanto
LikeLike
Thanks Bram. Worked great !!
LikeLike
Hi Bram,
One input.
For negative values in bar charts, labels show “inside” bar. To avoid it, I modified the code like following.
if(val > -1){
ctx.fillText(data, bar._model.x, bar._model.y – 5);
}
else{
ctx.fillText(data, bar._model.x, bar._model.y +14);
}
Thanks,
Sandeep
LikeLike
One question Bram.
If tooltips are enabled, these numbers come “above” tooltip. Can that be avoided?
Thanks,
Sandeep
LikeLike
Hi Sandeep,
I have tried the case, I have not found a solution until now.
Thanks,
Bramanto
LikeLike
Hi Bramanto,
Please check the solution below.
https://stackoverflow.com/questions/63217388/chart-js-tooltips-overlapped-by-bar-values
Thanks,
Sandeep
LikeLike
Hi Sandeep,
Thank you for your advice. Currently, I have not had a similar project. But this might be useful when I find a similar case. Thank you very much.
Bramanto
LikeLike
You can disable all animation to get rid of the flicker by setting options.events = []. You can also do something similar with a plugin using afterDatasetsDraw instead of the onComplete for animation to get rid of the flashing.
Some code here.
http://ashbrook.io/2020-09-04-adding-chart-labels-with-chart-js-to-bar-charts-and-stacked-bar-charts/
LikeLike
thnkyoi
LikeLike
I am trying the same code, it is working for bar graph, not for line graph. What changes has to be made to work for Line chart
LikeLike
Hi Basati Naveen,
You can see my latest post. Thanks for the inspiration.
Thanks,
Bramanto
LikeLike
Hey guys. I’ve use that solution, but when I click at the legend to hide some bars, the labels keep in chart. How to hide these labels?
LikeLike
Hi Alex, You can modify the following code:
this.data.datasets.forEach(function(dataset, i) {

                                var meta = chartInstance.controller.getDatasetMeta(i);

                                meta.data.forEach(function(bar, index) {

                                    var data = dataset.data[index];

                                    data = (!meta.hidden ? data : '');
ctx.fillText(data, bar._model.x, bar._model.y - 5);
});
});
Thanks,
Bramanto
LikeLike